Productivity map
A productivity map is your guide to the variable-rate application of potassium (K) and phosphorus (P) fertilizers, differential sowing, and precision soil sampling. The map is based on the NDVI values for the field measured over a selected period of time. The red color usually indicates low productivity of soil, while the green areas stand for higher productivity.
The productivity map’s algorithm analyzes all the cloudless satellite images available for the selected period. It makes sure that any anomalies are excluded from the calculation of the map to achieve the highest possible precision.
Productivity maps are built based on the images available for a selected period. Thus, it is possible to find out in which parts of the field the productivity (that is, in fact, the vegetation) was consistently high, and in which it was consistently low. The map is based on the NDVI vegetation index.
What are Productivity maps used for?
- These cards are used to apply potash and phosphorus fertilizers. These fertilizers need to be applied less frequently than Nitrogen fertilizers (depending on the culture, soil composition, and climate), because they take longer to be washed out of the soil, so the field analysis is compiled over a long period.
- Productivity maps can be used for differential seeding. For example, depending on the application strategy, more seeds can be sown in a more productive zone, and fewer seeds - in a less productive zone, to get the maximum yield; or vice versa.
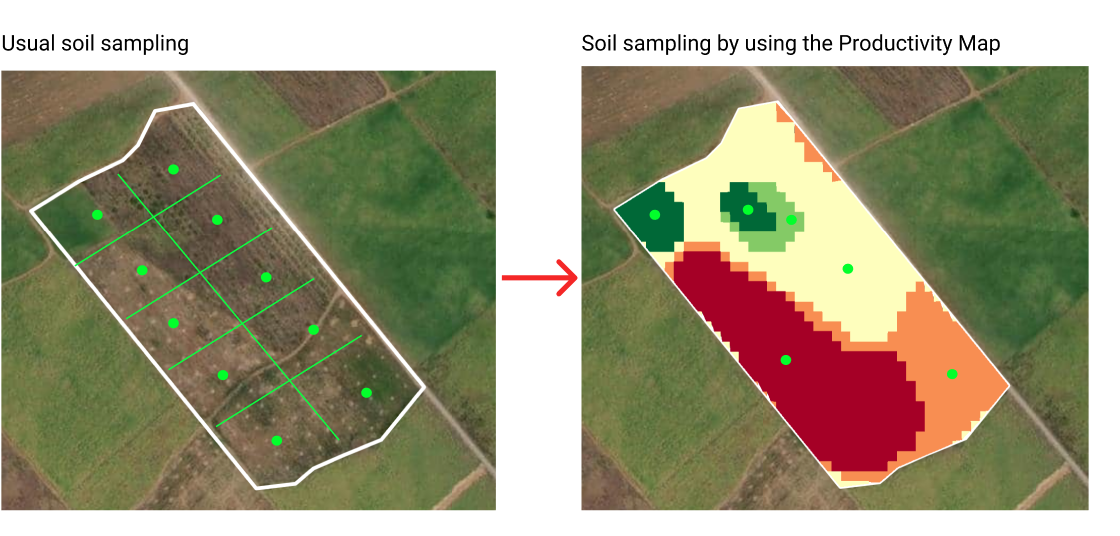
- Also, with the help of Productivity maps, you can define areas for sampling soil. Soil sampling is a mandatory process in agriculture, but in addition to standard grid sampling methods, this can be done in a differentiated manner. This method allows you to take a smaller number of samples due to taking them not along the grid, but from zones with different productivity (that is, with different vegetation). This method is more accurate and cost-effective.
How to build Productivity maps?
To build productivity maps, you need to select the time period for which you want to analyze the map (for example, the last season, or several years). All cloudless images for several years are analyzed, so the productivity map is created in about 5-15 minutes, depending on the field area and the number of cloudless images.
The result: 5 zones with different productivity across the field are shown, in which fertilizers need to be applied.
Further, the map can be downloaded in a SHP format and uploaded into the equipment. Soon we expect the release of an additional file format - ISO-XML, as well as the ability to calculate how much fertilizer and money you saved by opting for a differentiated application.
Create productivity map for field
This endpoint is used to create a productivity map for field. You get a response with "request_url", which includes "field_id" and "zoning map ID".
HTTP Request
POST 'https://api-connect.eos.com/api/zoning/vmaps/?api_key=<your_api_key>' \
--header 'Content-Type: application/json' \
--data-raw '{
    "field_id":"<field_id>",
    "vegetation_index":"index_name",
    "zone_quantity":"number",
    "min_zone_area":"number",
    "date_from":"date",
    "date_to":"date",
    "dataset_id":"satellite name",
    "need_answer":"fals"
}'
Request Parameters
| Request Path Parameter | Description |
|---|---|
| api_key | (Required) Apikey retrieved from developer portal; |
| Request Body Parameter | Description |
|---|---|
| field_id | (required) The field identifier; You can see the example how to get field_id here |
| vegetation_index | (required) The vegetation indices Available value: NDVI, NDRE, MSAVI, RECI default value: NDVI |
| zone_quantity | (optional) The number of field zones that need to be divided field Available value by 2 to 7 Default value: 3; |
| min_zone_area | (optional) The minimum area of the zone in m2 Default value: 1000; |
| date_from | (optional) Start of a time range (format YYYY-MM-DD) Default value: Current DateTime-365 days; |
| date_to | (optional) End of a time range (format YYYY-MM-DD) Default value: Current DateTime; |
| dataset_id | (optional) Use for this parameter one value from the list of sensor names (it's the value of dataset_id from Supported Datasets) Default value: sentinel2; |
| need_answer | (optional) the need to notify about the completion of the formation of the vegetation map by email Available value: false - do not notify and true- notify Default value: false; |
HTTP Response
The field has one or more created zones
status 201

{
    "status": "pending",
    "request_url": "link with ID"
}
Response parameters
| Parameter | Description |
|---|---|
| status | Task status; |
| request_url | The link with zoning map ID is assigned upon creation and is unique within the system; |
Immediate results are not available as our system requires time to process (calculate) the information for your field.
The typical processing time ranges from 30 to 180 seconds.
Response - The field hasn't zones
Status 404 Not Found
{"field_id":"id",
 "message": "This field has no available zoning maps"
}
Response - if the user does not have access to the specified field
Status 404 Not Found
{"field_id":"id",
 "message": "The field is not available to you"
}
Example: Create productivity map for field
Step 1:
curl --location --request POST 'https://api-connect.eos.com/zoning/productivity-map' \
--header 'Content-Type: application/json' \
--header 'x-api-key: <your_api_key>' \
--data '{
    "field_id":"9793351",
    "vegetation_index":"NDVI",
    "zone_quantity":"5",
    "min_zone_area":"1000",
    "date_from":"2024-01-01",
    "date_to":"2024-12-31",
    "dataset_id":"sentinel2",
    "need_answer":"true"
 }'
Immediate results are not available as our system requires time to process (calculate) the information for your field.
The typical processing time ranges from 30 to 180 seconds.
Response:
{
    "status": "pending",
    "request_url": "https://api-connect.eos.com/api/cz/backend/api/zoning/9793351/94de877d-c7e1-409e-acdd-076c2334807a/?api_key="
}
Step 2:
curl --location --request GET 'https://api-connect.eos.com/zoning/maps/9793351/94de877d-c7e1-409e-acdd-076c2334807a' \
--header 'x-api-key: <your_api_key>'
Response:
{
    "field_id": 9793351,
    "zmap_id": "94de877d-c7e1-409e-acdd-076c2334807a",
    "type_zmap": "productivity",
    "vegetation_index": "NDVI",
    "date": "2024-01-04",
    "zones": [
        {
            "zone_0": {
                "zone_area": 3762.49,
                "zone_p": 4886.35,
                "fertilizer": 0,
                "geometry": {
                    "type": "MultiPolygon",
                    "coordinates": [
                        []
                    ]
                }
            }
        },
        {
            "zone_1": {
                "zone_area": 11071.65,
                "zone_p": 14378.77,
                "fertilizer": 0,
                "geometry": {
                    "type": "MultiPolygon",
                    "coordinates": [
                        []
                    ]
                }
            }
        },
        {
            "zone_2": {
                "zone_area": 90244.57,
                "zone_p": 117200.74,
                "fertilizer": 0,
                "geometry": {
                    "type": "MultiPolygon",
                    "coordinates": [
                        [
                            [
                                -104.880861831367,
                                27.1686672823158
                            ],
                            [
                                -104.880957319232,
                                27.1686672823158
                            ],
                            [
                                -104.880957319232,
                                27.1687150881027
                            ],
                            [
                                -104.880981191198,
                                27.1687150881027
                            ],
                            [
                                -104.880981191198,
                                27.1687389909961
                            ],
                            [
                                -104.880957319232,
                                27.1687389909961
                            ],
                            [
                                -104.880957319232,
                                27.168786796783
                            ],
                            [
                                -104.880885703333,
                                27.168786796783
                            ],
                            [
                                -104.880885703333,
                                27.1687628938895
                            ],
                            [
                                -104.880861831367,
                                27.1687628938895
                            ],
                            [
                                -104.880861831367,
                                27.1687389909961
                            ],
                            [
                                -104.880837959401,
                                27.1687389909961
                            ],
                            [
                                -104.880837959401,
                                27.1686911852092
                            ],
                            [
                                -104.880861831367,
                                27.1686911852092
                            ],
                            [
                                -104.880861831367,
                                27.1686672823158
                            ]
                        ]
                    ]
                }
            }
        },
        {
            "zone_3": {
                "zone_area": 56996.5,
                "zone_p": 74021.42,
                "fertilizer": 0,
                "geometry": {
                    "type": "MultiPolygon",
                    "coordinates": [
                        []
                    ]
                }
            }
        },
        {
            "zone_4": {
                "zone_area": 610510.49,
                "zone_p": 792870.76,
                "fertilizer": 0,
                "geometry": {
                    "type": "MultiPolygon",
                    "coordinates": []
                }
            }
        }
    ],
    "total_fertilizer_consumption": 0,
    "image_link": "https://crop-monitoring-dtw-clustering-prod-s3-euc1.s3.amazonaws.com/1224889/27e2ed1ed7a8841e2d4a71073f9d6e39ab27882abdf06abcb6c94bc1/dtw-clustering-94de877d-c7e1-409e-acdd-076c2334807a.tiff?X-Amz-Algorithm=AWS4-HMAC-SHA256&X-Amz-Credential=ASIAVLSUNOHOUOX6TXOJ%2F20240104%2Feu-central-1%2Fs3%2Faws4_request&X-Amz-Date=20240104T110422Z&X-Amz-Expires=3600&X-Amz-SignedHeaders=host&X-Amz-Security-Token=IQoJb3JpZ2luX2VjENv%2F%2F%2F%2F%2F%2F%2F%2F%2F%2FwEaDGV1LWNlbnRyYWwtMSJHMEUCID4WHsr4FAJjfXeNUSI1D0hjosqwczIKOisPQ6GWNA7cAiEAnrcFTZTN6AcIvnNUa5VNOTkNn2KAZ7nfuJFiI%2FqHk%2B0q9QIIdBAEGgwzNjg0NzA0ODc1MTciDAlr2WNFtYizF4lNxyrSAhBq8KxsHSTrbvd3Hmj15b%2FCXAujAEVEbdTMG7x2A5ErPka2vFoAGKMBiSgjJmN5aspFKA8yB5wGLVEo6ZlDXeloxKZBzJLGyWb%2BS3Dz%2Ffh8SHZdHeFp9pLOZ5LfaKJhQm34HtOn4WFCI%2FimU0%2F5ryomrAjh%2FJUJuMwkZAI1b%2BDHiChz2Gm38t4eT7d%2Bh6Y3pQpuwPOLtUb%2FUkaF1RIwfYXUDPp%2F4zMrrbTxKVJgjtFzZ7SzAO3S18rn7JD0Kd%2B6GgNl8UaPJx%2F4PAsafAA%2B0O6Wid7QO3vOeVo64tC6zMpLC2cbh%2FvHo0lKk5JWoBl83s6iBA4d7oU9ESjBAfJCG4jVRuVnCi5aLPiWlpmhjgbK%2F9LMVRb%2B0smF5sHesJQKbo25DyzC0md4WKh3N4MpuvWIx2gSAUwGVJ1HV5cmG6mUYi2p1J698%2FpjWxDXi9Jgf8K%2BMLOh2qwGOp4Bp%2BzCLQM1gPV3vlwHDbetgsLrnYJ1ohJvHUyqXyArQzibftXmwW7%2FSNuMmbAupWxs7UcrAolgUNZiNNF5qZT1iRSB1SXHkS%2F0DkxFT2x2E5USgqEg4OtVbm8E%2BQGzsjJwLIkbV4iPcQOdfzvvspKALXe%2F5VWuMo5ChpQ%2BYInmR1rpt%2BC0nsGDDsAqukUC1NBOFJu66sFOTbftAqidABQ%3D&X-Amz-Signature=ac1cfda9cbcb194bb67072fc70055b29dd1824279960f2e7841bb6ce6c95e2e4"
}
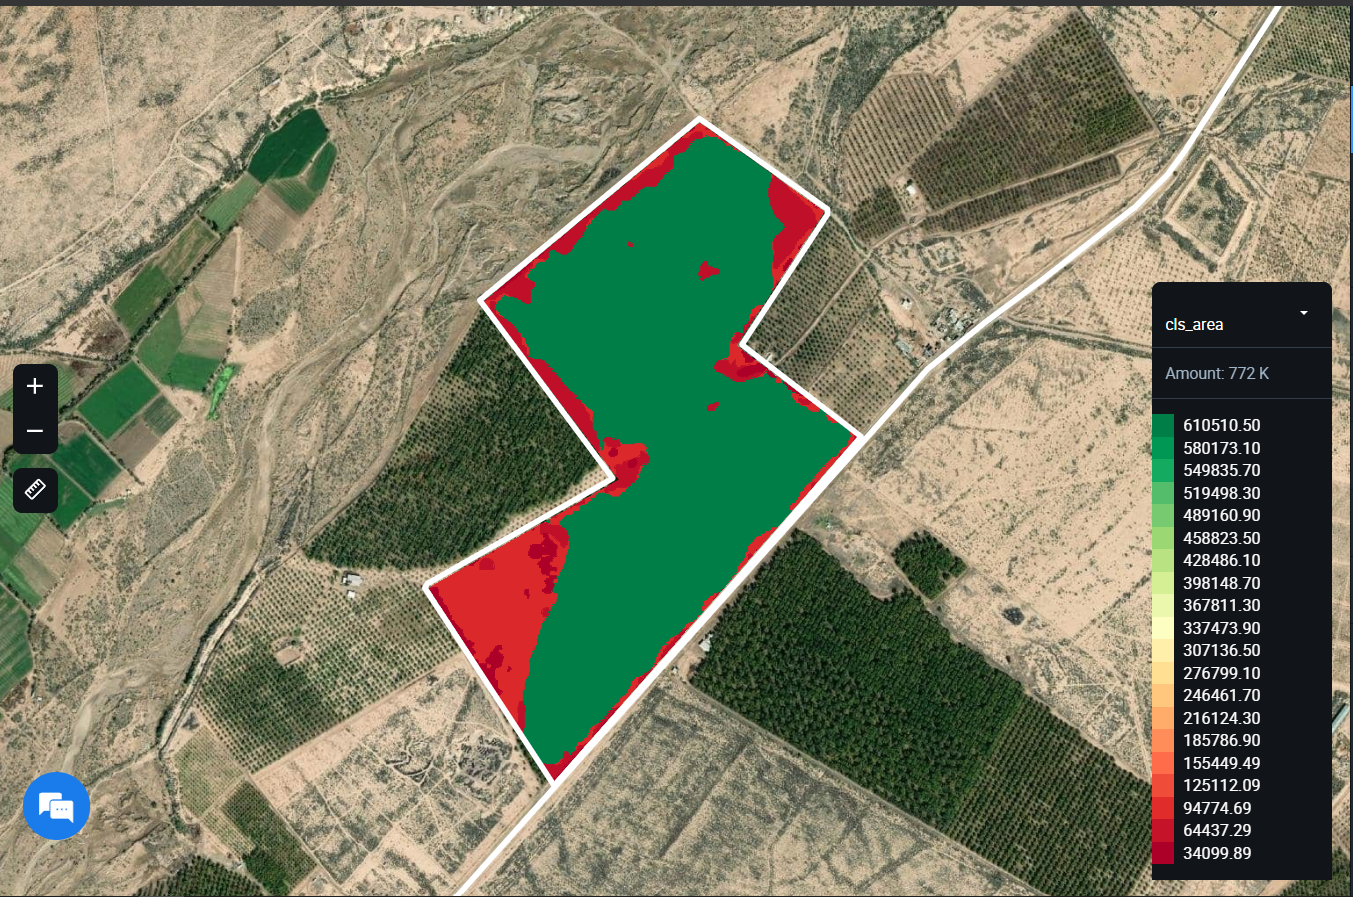
For example, displaying shp file of zoning map at the Crop Monitoring platform:
Error codes:
Response - The field hasn't zones
Status 404 Not Found
{"field_id":"id",
 "message": "This field has no available zoning maps"
}
Response - if the user does not have access to the specified field
Status 404 Not Found
{"field_id":"id",
 "message": "The field is not available to you"
}