High Resolution Imagery
First steps
Before you begin using High Resolution Imagery service, please ensure you have completed the following steps:
- Have an API Key, to obtain it follow the instructions in our section Quickstart 🚀
- Make sure you have access to the Dashboard API, For more information consult the section User Dashboard Guide
After this, you need to add to the system the fields or areas of interest from which you want to obtain the images.
To add fields or areas of interest to the system, please refer to the Field Management section in the Create Field section, or add directly from the Crop Monitoring platform.
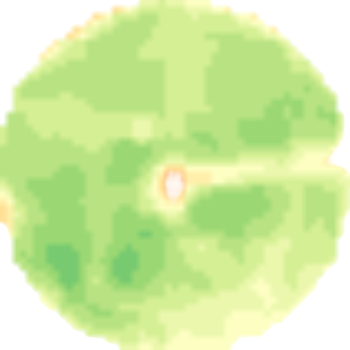
For example:
Request
curl --location --request POST 'https://api-connect.eos.com/field-management' \
--data '{
  "type": "Feature",
  "properties": {
      "name": "my field",
      "group": "my group",
      "years_data": [
          {
              "crop_type": "Wheat",
              "year": 2023,
              "sowing_date": "2023-04-01"
          }
      ]
  },
  "geometry": {
      "type": "Polygon",
      "coordinates": [
                       [
                           [-104.87931347024973, 27.166227117387663],
                           [-104.87190853064376,27.17371136921598],
                           [-104.87486446023671,27.175686643908065],
                           [-104.87271173924485,27.178599422270565],
                           [-104.87575466983847,27.180525385046096],
                           [-104.88103048496039,27.176643443128853],
                           [-104.87771956045358,27.172771682872458],
                           [-104.88236756436531,27.17042134807906],
                           [-104.87931347024973,27.166227117387663]
                           ]
                       ]
  }
}'
Response
{
   "id": 9793351,
   "area": "77.0"
}
Once the fields or areas of interest have been created, you can view the Field IDs in the API Dashboard by clicking on the "My Fields" panel on the left: API Dashboard
Once you have added the fields or areas of interest, please communicate the Field IDs to your Account Manager or contact support to proceed with service activation.
Make sure you have added the fields or areas of interest correctly, once the service is activated, they cannot be modified.
Please use the instructions in the Field Management section to verify and correct the fields before the activation, you also can complete this process in the Crop Monitoring platform.
Search Imagery High Resolution Imagery
Before you search for available scenes from the High Resolution Imagery, please ensure that you have added the fields to the system and that you have been confirmed to have activated the service. For more information, see the First Steps section.
To start searching High Resolution images/scenes of fields or areas of interest using their Field IDs. Place the Field ID of the field or area of interest at the end of the Endpoint, for example:
POST'https://api-connect.eos.com/search\_hr\_scenes/for-field/\<Your\_fiel\_id\>'
Table of parameters available
| Parameter | Description | Is required |
|---|---|---|
| date_start | Initial date of the time lapse to retrieve the images. The service computes statistics for each image starting from the time indicated in the criteria. Format: Year-Month-Day Example: "2024-01-30" | required |
| date_end | Ending date of the time lapse to retrieve the images. Format: Year-Month-Day Example: "2024-01-30" | required |
| sensors | For default "planet" | required |
| max_cloud_cover_in_aoi | Maximum cloud cover in AOI. Scenes for which AOI contains more than this percent of clouds shall be placed into “errors” array in response. Default: 100 | not required |
Request
curl --location 'https://api-connect.eos.com/search_hr_scenes/for-field/<FielD-ID>' \
--header 'Content-Type: application/json' \
--header 'x-api-key: <your-APIKEY>' \
--data '{
   "params": {
           "date_start": "2025-01-01",
       "date_end": "2025-03-31",
       "max_cloud_cover_in_aoi": 100,
       "sensors": [
           "planet"
       ]
   }
}'
Response
{
  "planet": [
    {
      "scene_id": "20250331_174705_30_24f7",
      "cloud": 0.0,
      "clear_percent": null,
      "shadow_percent": null,
      "heavy_haze_percent": null,
      "light_haze_percent": null,
      "date": "2025-03-31",
      "time": "17:47:05.300594",
      "status": "pending",
      "sensor": "planet",
      "download_url": null,
      "view_id": "planet/<view_id>/20250331_174705_30_24f7",
      "instrument": "PSB.SD"
    },
    {
      "scene_id": "20250329_175659_72_254a",
      "cloud": 2.0,
      "clear_percent": null,
      "shadow_percent": null,
      "heavy_haze_percent": null,
      "light_haze_percent": null,
      "date": "2025-03-29",
      "time": "17:56:59.728429",
      "status": "pending",
      "sensor": "planet",
      "download_url": null,
      "view_id": "planet/<view_id>/20250329_175659_72_254a",
      "instrument": "PSB.SD"
    },
    {
      "scene_id": "20250327_175014_82_24f7",
      "cloud": 8.0,
      "clear_percent": null,
      "shadow_percent": null,
      "heavy_haze_percent": null,
      "light_haze_percent": null,
      "date": "2025-03-27",
      "time": "17:50:14.820454",
      "status": "pending",
      "sensor": "planet",
      "download_url": null,
      "view_id": "planet/<view_id>/20250327_175014_82_24f7",
      "instrument": "PSB.SD"
    }
  ]
}
Field High Resolution Imagery
The High Resolution Imagery API enables you to visualize your area of interest, offering options such as natural color or various vegetation indices for enhanced analysis.
Table of parameters available
| Parameter | Description | Is required |
|---|---|---|
| view_id | a view_id parameter for "search scene" step. For example: "view_id": "planet/45a9be182cbc0735ab2b42db6eed35ce/20241212_173024_65_250e" | required |
| index | any indices for supported bands, check out the Reference information. For example: NDVI | required |
| format | choose an image format that you need. Supported formats: .tiff, .jpeg, .png | required |
Index images can be downloaded using the API, for this a view id and a field id are needed.
Step 1:
Request
curl --location 'https://api-connect.eos.com/field-imagery/indicies/<FielD-ID>' \
--header 'Content-Type: application/json' \
--header 'x-api-key: <your-APIKEY>' \
--data '{
    "params": {
        "view_id": "planet/d0802cf6e011ef5bbbd9cfcf0bdf394c/20250106_174324_55_24e5",
        "index": "NDVI",
        "format": "png"
    }
}'
Response
{
    "status": "created",
    "request_id": "82053adf-f43d-40f1-b280-50f502021aae"
}
Step 2:
Use the request_id returned in the answer of the previous end point and replace it by the end of this endpoint to get the results of the search
Request
curl --location 'https://api-connect.eos.com/field-imagery/indicies/<FielD-ID>/<request_id>' \
--header 'x-api-key: <your-APIKEY>'
Response:
Field Analytics High Resolution Imagery
Alternatively, for more detailed insights, you can use the Field Analytics endpoint described in this section.
Field Analytics provides statistical computations—such as average, minimum, maximum, standard deviation, variance, and classified areas—based on band math expressions applied to optical imagery within a selected date range.
For example, you can retrieve the average vegetation index for a specific field, along with cloud coverage, relevant dates, and scene view IDs.
Table of parameters available
| Parameter | Description | Is required |
|---|---|---|
| date_start | Initial date of the time lapse to retrieve the images. Format - Year- Month-day "2024-01-01" | required |
| date_end | Ending date of the time lapse to retrieve the images. Format - Year- Month-day "2024-01-01" | required |
| index | Set this parameter with a value, alias, expression, or an array of band math expressions to retrieve or compute. Refer to the Reference Information section for details. | required |
| data_source | Must be "planet" | required |
| distinct_by_date | When True, pre-filters scene list so there is only 1 scene per 1 day. By default true (all scenes returned) | optional |
| max_cloud_cover_in_aoi | filter scenes by upper threshold for cloud coverage percentage; by default 0 | optional |
Example:
Step 1:
Request
curl --location 'https://api-connect.eos.com/field-analytics/trend/<FielD-ID>' \
--header 'Content-Type: text/plain' \
--header 'x-api-key:<your-APIKEY>' \
--data '{
    "params": {
        "date_start": "2025-01-01",
        "date_end": "2025-03-31",
        "index": "NDVI",
        "data_source": "planet"
    }
}'
Response:
{
    "status": "created",
    "request_id": "92036d7a-3611-4886-b00e-3ca01473e19d"
}
Step 2:
Use the request_id returned in the answer of the previous end point and replace it by the end of this endpoint to get the results of the search
Request:
curl --location 'https://api-connect.eos.com/field-analytics/trend/<FielD-ID>/<request_id>' \
--header 'x-api-key:<your-APIKEY>'
Response:
{
  "status": "success",
  "result": [
    {
      "date": "2024-12-19",
      "view_id": "planet/45a9be182cbc0735ab2b42db6eed35ce/20241219_172517_98_24d7",
      "cloud": 0.0,
      "min": 0.2973077595233917,
      "max": 0.3577632009983063,
      "average": 0.3282940481547956,
      "variance": 0.0001512446520849923
    },
    {
      "date": "2024-11-23",
      "view_id": "planet/45a9be182cbc0735ab2b42db6eed35ce/20241123_173119_84_2507",
      "cloud": 0.0,
      "min": 0.44352900981903076,
      "max": 0.5218878388404846,
      "average": 0.4849758247534434,
      "variance": 0.00021311249504167925
    },
    {
      "date": "2024-10-31",
      "view_id": "planet/45a9be182cbc0735ab2b42db6eed35ce/20241031_164215_17_24c4",
      "cloud": 0.0,
      "min": 0.012366389855742455,
      "max": 0.05177208036184311,
      "average": 0.02990689780563116,
      "variance": 0.00004187759744971217
    },
    {
      "date": "2024-09-29",
      "view_id": "planet/45a9be182cbc0735ab2b42db6eed35ce/20240929_172742_97_2518",
      "cloud": 0.0,
      "min": 0.3594328463077545,
      "max": 0.416327565908432,
      "average": 0.3856685037414233,
      "variance": 0.00011206725585096143
    },
    {
      "date": "2024-08-29",
      "view_id": "planet/45a9be182cbc0735ab2b42db6eed35ce/20240829_163657_36_24ba",
      "cloud": 85.18518518518519,
      "min": 0.1543257236480713,
      "max": 0.2274741232395172,
      "average": 0.18950273282825947,
      "variance": 0.0005212436850960366
    }
  ]
}
Reference information High Resolution Imagery
Technical Details
| Specification | PS2 Sensor | PSB.SD Sensor |
|---|---|---|
| Imaging Mode | Push-broom scanner | Push-broom scanner |
| Swath Width | 24.6 km | 24.6 km |
| Spatial Resolution | ~3.7 m (native) | ~3.7 m (native) |
| Spectral Bands | 4 bands | 8 bands |
| Revisit Frequency | Daily (global coverage) | Daily (global coverage) |
| Data Availability | 2016 - Present | 2020 - Present |
PS2 Sensor Bands
| Band Name | Wavelength (nm) | Primary Use |
|---|---|---|
| Blue | 455 - 515 | Coastal, water analysis |
| Green | 500 - 590 | Vegetation health |
| Red | 590 - 670 | Crop monitoring |
| NIR | 780 - 860 | Biomass, vegetation |
PSB.SD Sensor Bands
| Band Name | Wavelength (nm) | Primary Use |
|---|---|---|
| Coastal Blue | 431 - 452 | Water and coastal analysis |
| Blue | 465 - 517 | General atmospheric studies |
| Green I | 547 - 583 | Vegetation and chlorophyll |
| Green II | 600 - 629 | Plant stress analysis |
| Red | 665 - 689 | Vegetation monitoring |
| Red Edge | 703 - 727 | Crop health detection |
| NIR I | 845 - 885 | Biomass estimation |
| NIR II | 897 - 917 | Vegetation stress |
Supported Indices
High Resolution imagery supports various vegetation and water indices for enhanced analysis:
| Index | Formula | Application |
|---|---|---|
| NDVI | (NIR - Red) / (NIR + Red) | Vegetation health monitoring |
| NDRE | (NIR - Red Edge) / (NIR + Red Edge) | Mid-season crop monitoring |
| MSAVI | (2 * NIR + 1 - sqrt((2 * NIR + 1)^2 - 8 * (NIR - Red))) / 2 | Early-stage crop assessment |
| RECI | (NIR - Red Edge) / Red Edge | Chlorophyll content estimation |
Integration with EOSDA API
High Resolution Imagery is accessible through EOS API CONNECT. Users can request imagery, compute indices, and retrieve metadata using structured API requests. The integration supports:
- Search for available scenes based on date and cloud coverage.
- Retrieval of full-resolution imagery in GeoTIFF format.
- Index calculation for supported bands and vegetation indices.
- Field analytics for temporal vegetation monitoring.
For implementation details, refer to the API Documentation.
For further assistance, Contact support.