User Dashboard Guide
Introduction
Welcome to the EOSDA API Connect User Dashboard, we will guide you through key technical features for effective API management
Accessing the User Dashboard
To access the User Dashboard, navigate to https://api-connect.eos.com/user-dashboard/statistics and log in using your EOSDA API Connect credentials. Once logged in, you will be presented with a set of tools to monitor and optimize your API usage.
Dashboard Overview
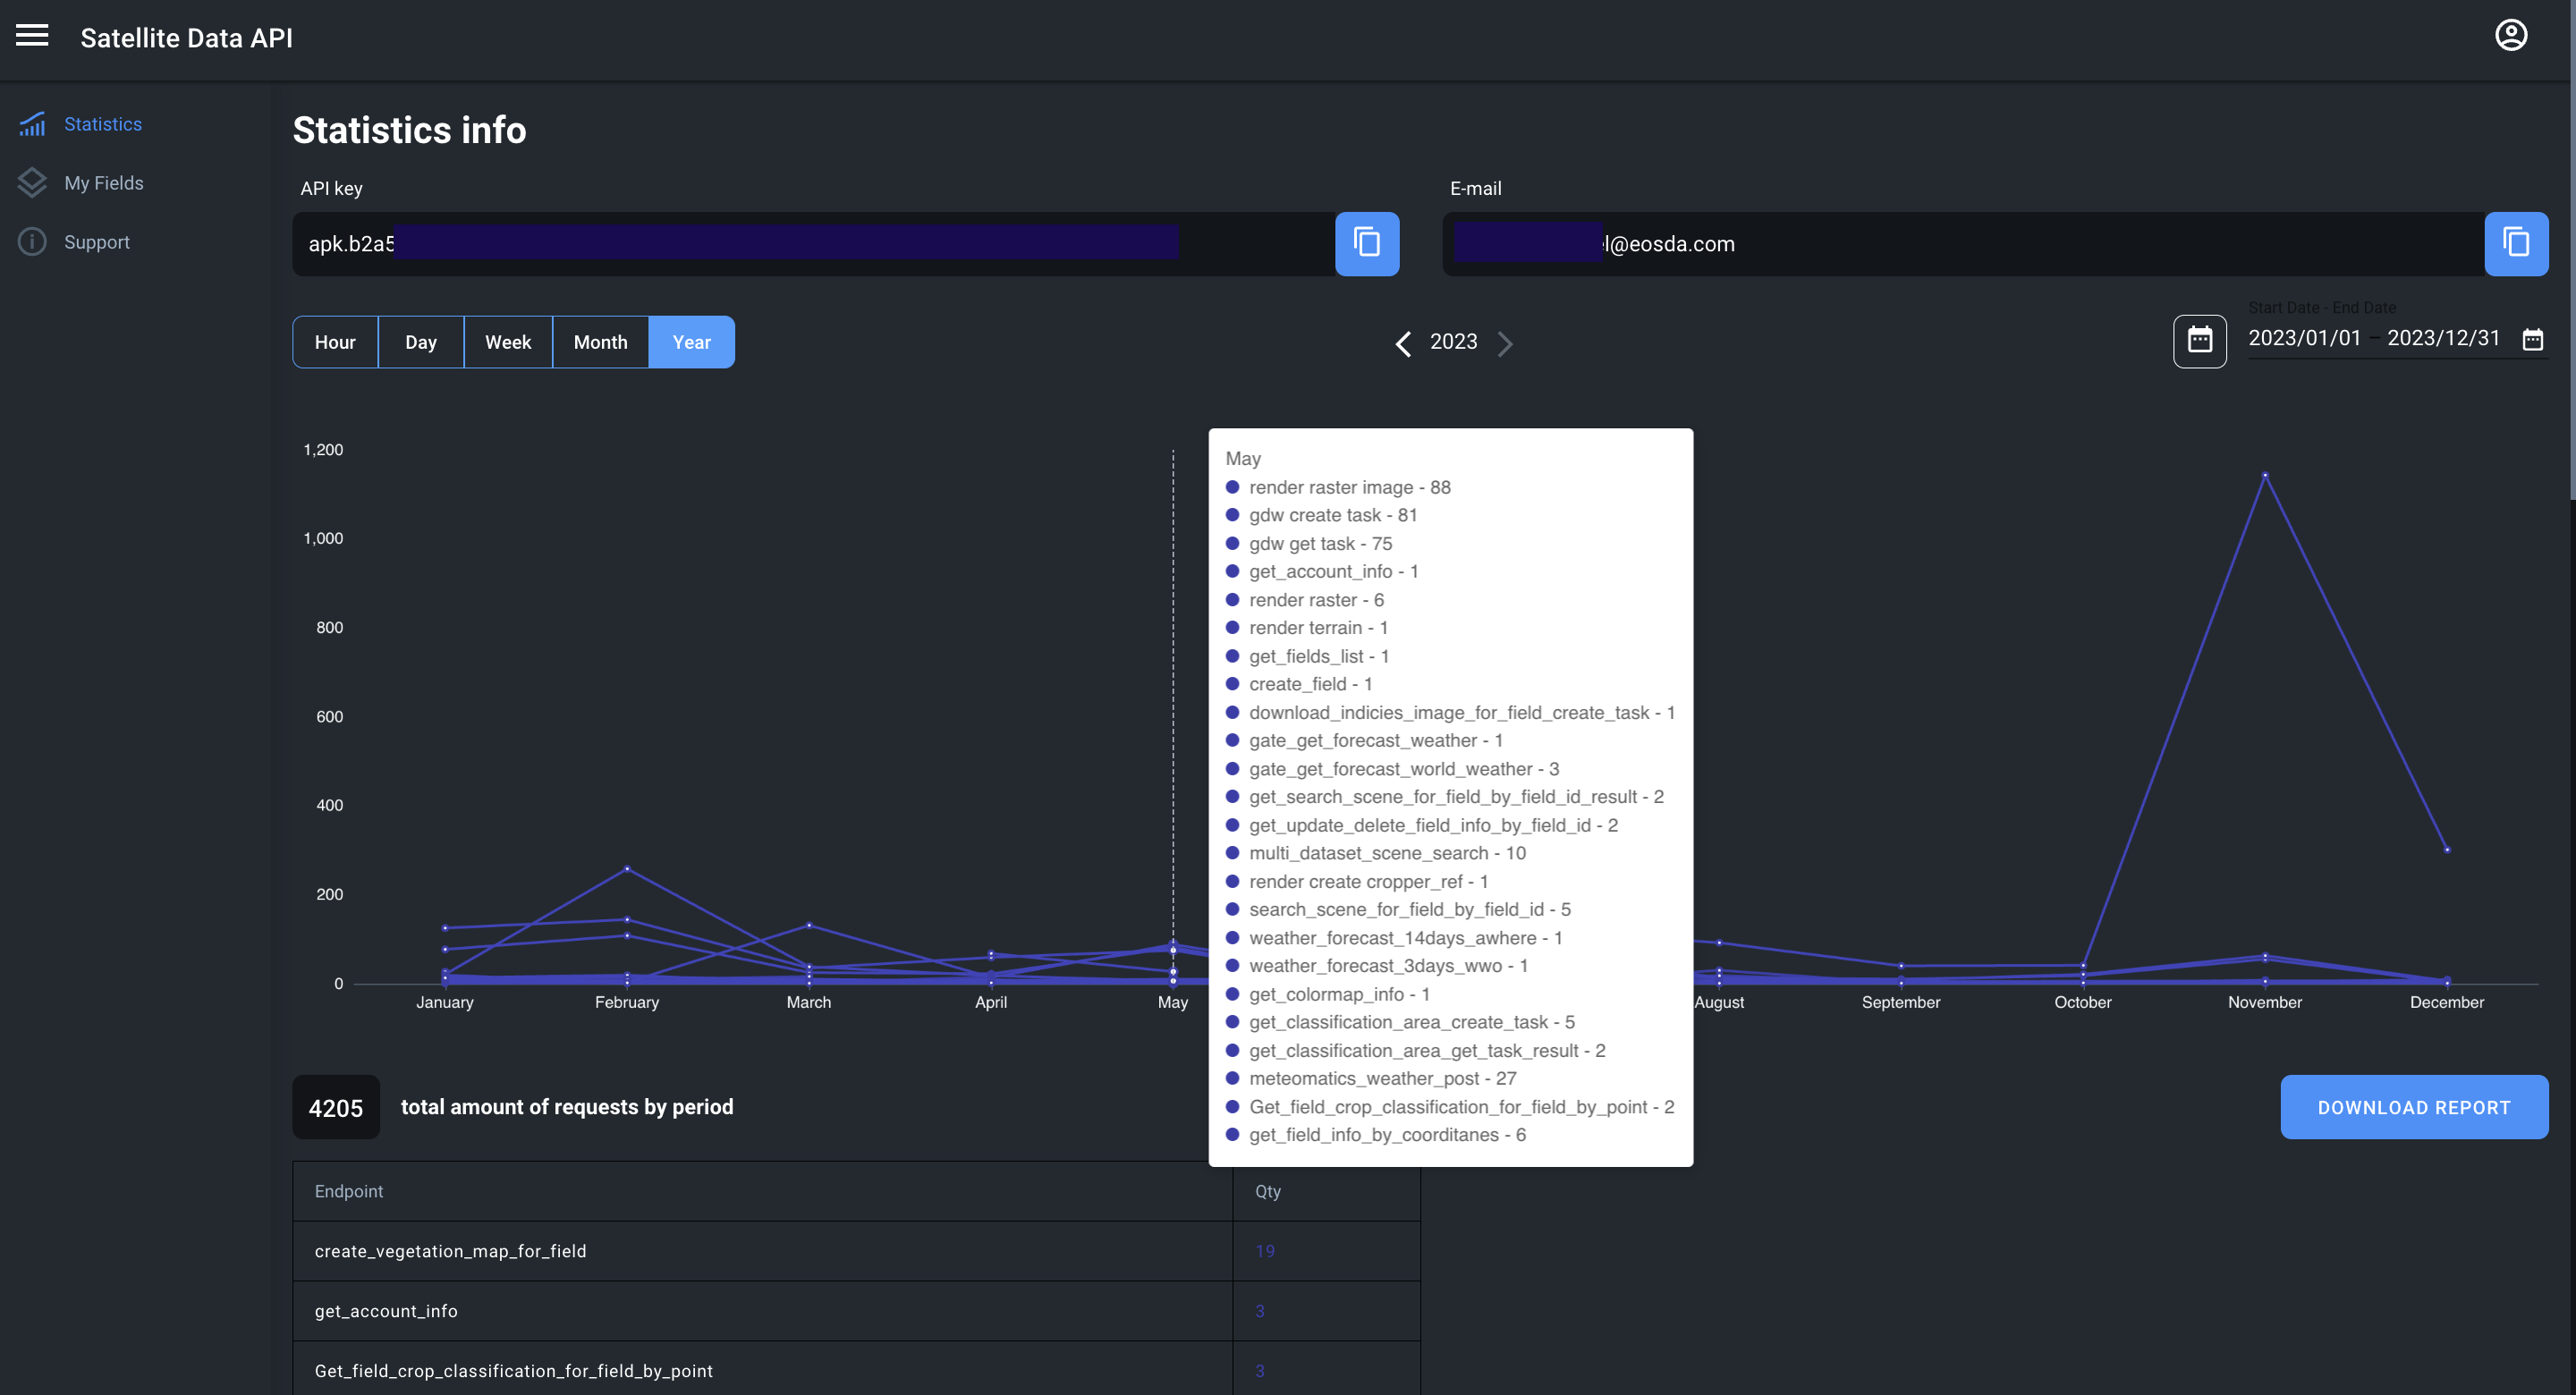
The User Dashboard is designed to provide you with a view of your API usage and performance metrics. Here's an overview of the key sections:
API Key Display: Easily identify associated API keys.
Usage Statistics
- Date Range: Analyze API usage trends over custom date ranges.
- Endpoint Details: Granular insights into individual endpoint usage.
- Download Reports Export Options: Download usage reports in CSV or Excel formats.
Conclusion
Optimize your API strategy with precise insights from the EOSDA API Connect User Dashboard. For technical support or feedback, contact api.support@eosda.com. Explore and enhance your API management experience with EOSDA.